

My first and most read blog post, by an order of magnitude, is this one about plotly.
This is probably why I recently received an email asking about how you can have two different barmodes simultaneously in Plotly subplots. The first one should be stacked and the second one should be grouped. As always I started off by searching around to see if someone else had solved this problem. However, the only post I could find was an answer on the plotly community forum saying it can't be done. Spoiler alert, it can be done. Let's get into it!
Sidenote: If you just want to dive into the code, you can find the entire example as one large block at the end.
The data
I am using the same data as for my previous blog post:
data = {
    "original":[15, 23, 32, 10, 23],
    "model_1": [4,   8, 18,  6,  0],
    "model_2": [11, 18, 18,  0,  20],
    "labels": [
        "feature",
        "question",
        "bug",
        "documentation",
        "maintenance"
    ]
}
You can think of this as a table/dataframe with four columns: original, model_1, model_2 and label. The content of the lists is the rows.
Plot
Based on the results from my initial research there is no straightforward way for doing this. However, a natural starting point is looking at how to do subplots to start with. First of all, let's look at what we need from plotly:
from plotly.subplots import make_subplots
from plotly import graph_objects as go
graph_objects, shortened to go, is the core library of plotly. For this example, all we will use is the Bar class, which represents a bar chart. I think all of you already figured out that we will use makes_subplots to make, well, subplots.
A standard subplot to start
Here we go, a standard subplot with two bar charts to start off.
fig = make_subplots(rows=2, cols=1)

# Subplot 1
fig.add_trace(
    go.Bar(
        name="Original",
        x=data["labels"],
        y=data["original"],
    ),
    row=1,
    col=1,
)

# Subplot 2
fig.add_trace(
    go.Bar(
        name="Model 1",
        x=data["labels"],
        y=data["model_1"],
    ),
    row=2,
    col=1,
)

fig.show()
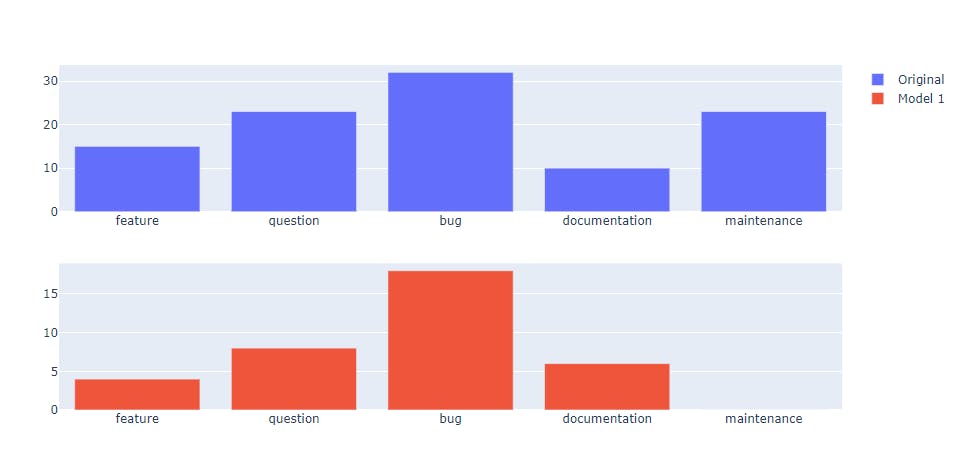
Not a lot of interesting things going on here. We create a subplot with two rows and one column. We then add two bar charts, one to the first row and one to the second row. The result looks like this:
Multiple bar charts in each subplot
Okay, now we have a solid starting point. The make_subplots function returns a single figure object, to which we add our traces. When we add the traces we tell plotly which of the subplots the trace should be added to. Let's expand our solutions to contain multiple bar charts in each of the subplots.
fig = make_subplots(rows=2, cols=1)

# Subplot 1
fig.add_trace(
    go.Bar(
        name="Original",
        x=data["labels"],
        y=data["original"],
    ),
    row=1,
    col=1,
)
fig.add_trace(
    go.Bar(
        name="Model 1",
        x=data["labels"],
        y=data["model_1"],
    ),
    row=1,
    col=1,

)

# Subplot 2
fig.add_trace(
    go.Bar(
        name="Original",
        x=data["labels"],
        y=data["original"],
    ),
    row=2,
    col=1,
)
fig.add_trace(
    go.Bar(
        name="Model 1",
        x=data["labels"],
        y=data["model_1"],
    ),
    row=2,
    col=1,
)

fig.show()
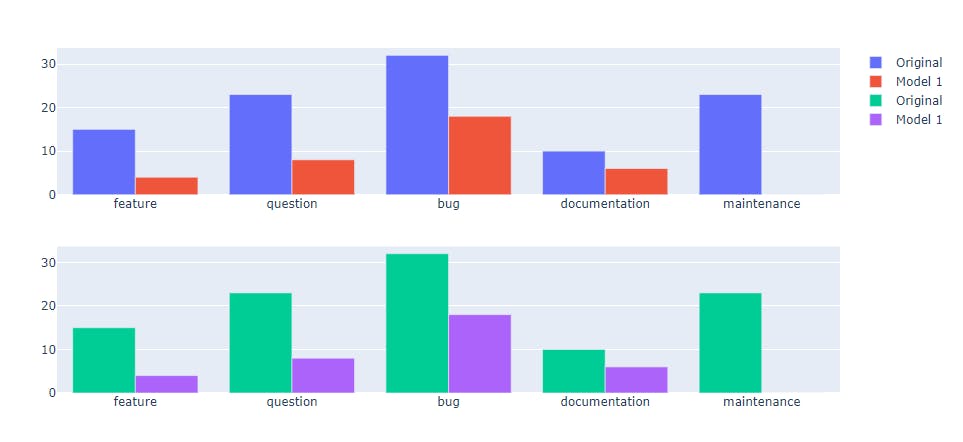
To each of the subplots, we add two bar charts, both containing the same data. The result looks like this.
The Solution
Now we can get to the final step of the solution. Styling the independent bar charts. Usually, we would have used something like this to change to a stacked bar chart:
fig.update_layout({"barmode":"stack"})
However, this automatically targets both subplots and there is no way of changing that. The solution then is to use the same trick as in my previous plotly post and manually create stacked and grouped bar charts. This works as this changes the Bar object directly and isn't a style on the Figure.
fig = make_subplots(rows=2, cols=1)

# Subplot 1 - Stacked
fig.add_trace(
    go.Bar(
        name="Original",
        x=data["labels"],
        y=data["original"],
        offsetgroup=0,
    ),
    row=1,
    col=1,
)
fig.add_trace(
    go.Bar(
        name="Model 1",
        x=data["labels"],
        y=data["model_1"],
        offsetgroup=0,
        base=data["original"]
    ),
    row=1,
    col=1,

)

# Subplot 2 - Grouped
fig.add_trace(
    go.Bar(
        name="Original",
        x=data["labels"],
        y=data["original"],
        offsetgroup=0,
    ),
    row=2,
    col=1,
)
fig.add_trace(
    go.Bar(
        name="Model 1",
        x=data["labels"],
        y=data["model_1"],
        offsetgroup=1,
    ),
    row=2,
    col=1,
)

fig.show()
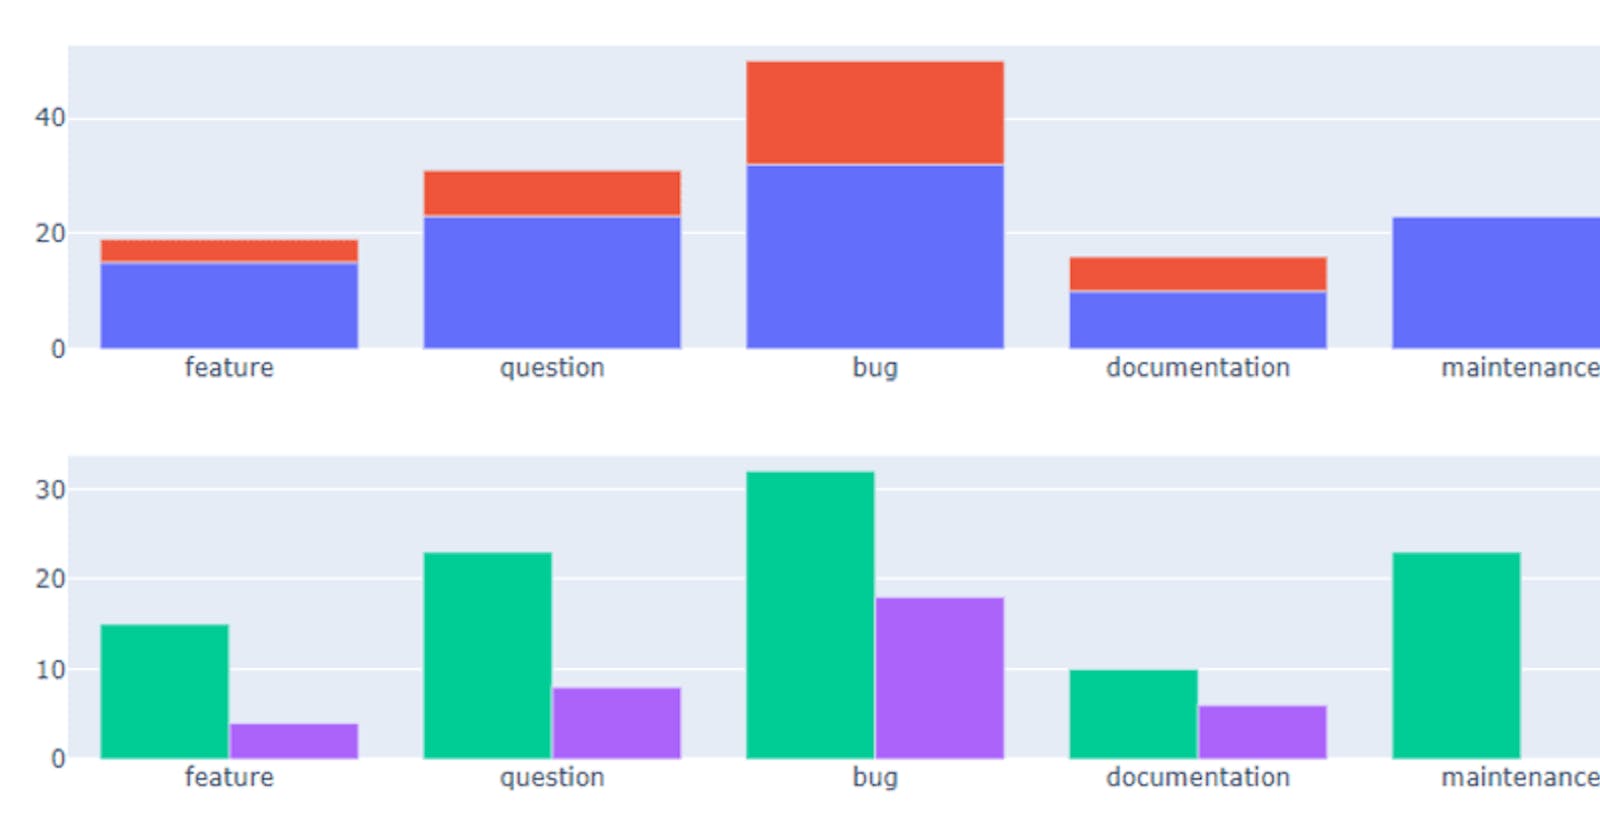
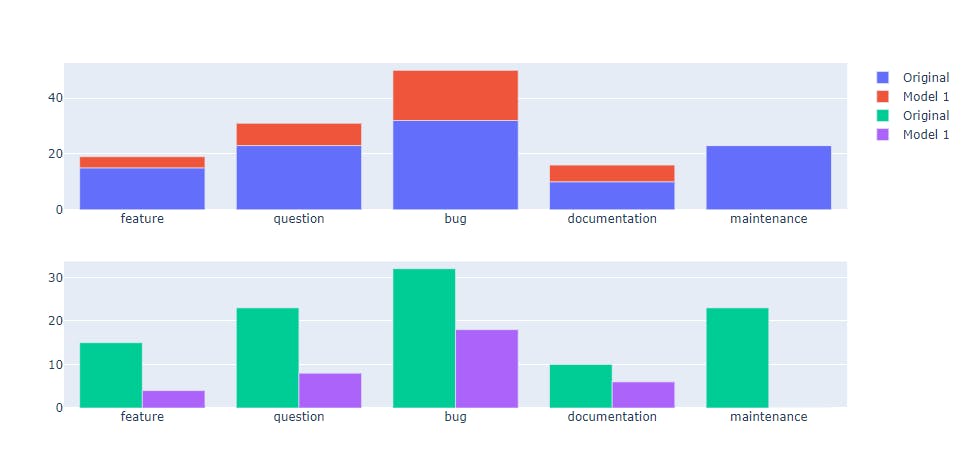
When creating the stacked version we set the offsetgroup to zero for both Bar objects. This places them in the same position along the x-axis. However, the second will only be rendered in front of the first one, instead of above. Therefore, we set the base parameter for the second Bar object to be the list of values of the other one. This shifts the y-position of each bar in "Model 1", based on the height of the corresponding bar in "Original", creating a stacked bar chart. To create the grouped subplot, all we have to do is to assign different values to the offsetgroup of the Bar objects.
Sidenote: You can read more about how this stacking and grouping works in my previous post.
Now, for the final reveal.
Entier example
Here is all code for the entire finished example. As long as you have plotly installed you can just copy-paste this into e.g. a Jupyter notebook and get the final plot.
from plotly.subplots import make_subplots
from plotly import graph_objects as go

data = {
    "original":[15, 23, 32, 10, 23],
    "model_1": [4,   8, 18,  6,  0],
    "model_2": [11, 18, 18,  0,  20],
    "labels": [
        "feature",
        "question",
        "bug",
        "documentation",
        "maintenance"
    ]
}


fig = make_subplots(rows=2, cols=1)

# Subplot 1 - Stacked
fig.add_trace(
    go.Bar(
        name="Original",
        x=data["labels"],
        y=data["original"],
        offsetgroup=0,
    ),
    row=1,
    col=1,
)
fig.add_trace(
    go.Bar(
        name="Model 1",
        x=data["labels"],
        y=data["model_1"],
        offsetgroup=0,
        base=data["original"]
    ),
    row=1,
    col=1,

)

# Subplot 2 - Grouped
fig.add_trace(
    go.Bar(
        name="Original",
        x=data["labels"],
        y=data["original"],
        offsetgroup=0,
    ),
    row=2,
    col=1,
)
fig.add_trace(
    go.Bar(
        name="Model 1",
        x=data["labels"],
        y=data["model_1"],
        offsetgroup=1,
    ),
    row=2,
    col=1,
)

fig.show()